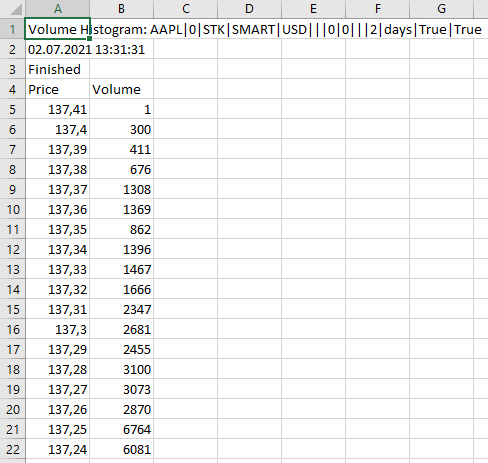
With XEWION for TWS enthusiasts can query the raw volume histogram data for up to 30 days.
Volume histograms are crucial for traders because they provide insight into the trading activity and market interest at different price levels, helping to identify potential support and resistance zones. Additionally, they reveal the strength of price movements, indicating whether price trends are supported by significant trading volume, which can confirm or challenge the validity of those trends.
Also filtering for regular trading hours is possible. You will get a list of prices and associated traded volume.
Screenshots
- Clear Visualization: Excel helps create easy-to-read volume histograms, highlighting patterns and trends.
- Comprehensive Analysis: Combine volume data with other metrics for deeper market insights.
- Regular Trading Hours Filter: Refine your data to focus exclusively on regular trading hours, ensuring relevant and accurate insights.
Acquiring volume histogram data is crucial for traders who seek to understand market dynamics and make informed decisions. Ready to enhance your trading analysis with detailed volume histogram data?
XEWION for TWS offers a powerful feature to access and analyze volume histogram data directly in Excel. With seamless integration, comprehensive datasets, and user-friendly functionality, this tool empowers traders with the insights needed to succeed in the dynamic world of trading. Start leveraging the power of detailed volume data today and transform your trading strategies.


